Building Code Simplifications
The design of structures such as towers and buildings requires the engineer to account for the influence of external forces such as wind pressure and ice accumulation on the structure. For tall structures such as communication or broadcast towers and transmission line towers the wind force will vary with height, which must be taken into account in order to meet the risk based reliability criteria as specified in building codes.
Codes such as ASCE7 and TIA 222 in the US and CSA S37 in Canada provide maps of the basic extreme wind and provide procedures for calculating the vertical wind profile based on terrain type and topographic influences which are based on guidelines derived from meteorological considerations.
These procedures are of necessity overly simplified and cannot deal with the complex situations encountered in the real world. This is acknowledged in the Codes which suggest, and in some cases require, that detailed site-specific analysis be carried out.
The Profile application has been developed from our experience over the past 15 years in dealing with simple and complex meteorological situations and topographic situations in order to provide reliable wind profiles using measured data from nearby airports and applying tested procedures based on established meteorological knowledge. This application has been used by ICE Inc. (www.ice-inc.co) to provide advanced site-specific analysis for towers and structures for many clients in Canada, the US, and Internationally.
There are three principal simplifications in the building codes which cause problems for the proper assessment of the extreme wind profile. The Profile application uses the original Simple Guidelines meteorological treatment which is based on the current understanding of the Atmospheric Boundary Layer and which forms the basis of the North American Building Codes.
1 The wind speed profile near the surface is the result of viscous drag on the air in contact with the surface and the mechanical turbulence which acts to propagate the effect of the drag to higher levels in the moving air. The viscous drag is a function of the roughness of the surface, which describes the size and number of obstructions to the flow, and is therefore continuously variable over the region. The building codes on the other hand make the simplification that roughness is categorized into 3 or 4 distinct categories, and that one category describes the profile of wind for a selected location if the category can be attributed to a sufficiently large area surrounding the site.
In ASCE 7 the C category (open terrain) corresponds to roughness of 0.03 m (ranging between 0.03 and 0.29 m); the B category (rough terrain) corresponds to roughness ranging between 0.3 and 0.5; and the D Category (smooth surface such as water) corresponds to roughness length less than 0.02 m. The difference between the three profiles is very large and while the code allows for interpolation, it does not specify how the interpolation is to be carried out.
The Profile approach is to determine the roughness length for each 45 degree sector at the site from land use/land cover data, then use this roughness to calculate the friction velocity and use the profile equation for the Boundary Layer.
2 The second and related issue is that where there is an abrupt change in roughness along the fetch to the structure, a new sub-layer is generated which grows in height as the flow continues downwind. The effect of this is to create a modified profile which reflects the new roughness in the lower layer and which retains the original profile above the growing sub-layer. This means that the profile can no longer be described by a single power law equation, which is why the specified minimum fetch must be considered in the classification into categories.
The problem with this is that at a given location a short tower may be affected by one profile while a tall tower will be affected by one profile near the ground and another profile above the height of the lower boundary layer.
The Profile application uses the logarithmic profile which provides methods for dealing with changes in roughness length on the approach to the topographic feature, as well as changes on the slope of the feature. In effect the Profile approach provides a means to account for the history of the lower boundary layer to provide a more complete picture of the wind speed profile.
3 Another issue with the code prescriptions is that in calculating the terrain and topography corrections to the wind speed profile, the user is to assume that the worst case basic wind (as shown on wind maps) should apply for all wind directions. This prescription leads to severe over-estimation of the potential extreme wind in many situations. Some codes adopt procedures to reduce the effect of such an assumption based on probability arguments for wind direction such as those based on wind roses.
The Profile approach for dealing with this issue is to perform a directional extreme wind determination based on the nearest observing station data. This involves sampling of the long term data for each of eight directional sectors and performing the extreme wind statistics including return period determination for all required MRI followed by conversion of the observed extreme wind to Basic Wind specification by determining the directional roughness and topography at the airport. The resulting directional extreme basic wind can then be applied at the selected site with the sectoral roughness and topographic parameters.
In addition to dealing with the above listed shortcomings of the Codes, the approach of using the hourly meteorological observations for the nearest appropriate site provides a more accurate localized basic wind than provided by generalized maps. In fact the ASCE7 identifies areas of the country where the map winds are not reliable and recommends site specific analysis.
The approach also allows localized calculation of the glaze and rime ice accumulations on structures as a function of height above ground and duration of the event and takes into account the elevation of the structure and change of temperature with height.
Application Components
The User Interface shown below provides a number of Tabbed Panels for specifying Control parameters, Basic Wind data, and calculating procedures for the wind profile arriving at the base of the topographic feature, the wind speed up profile changes, and the changes in roughness on the slope.
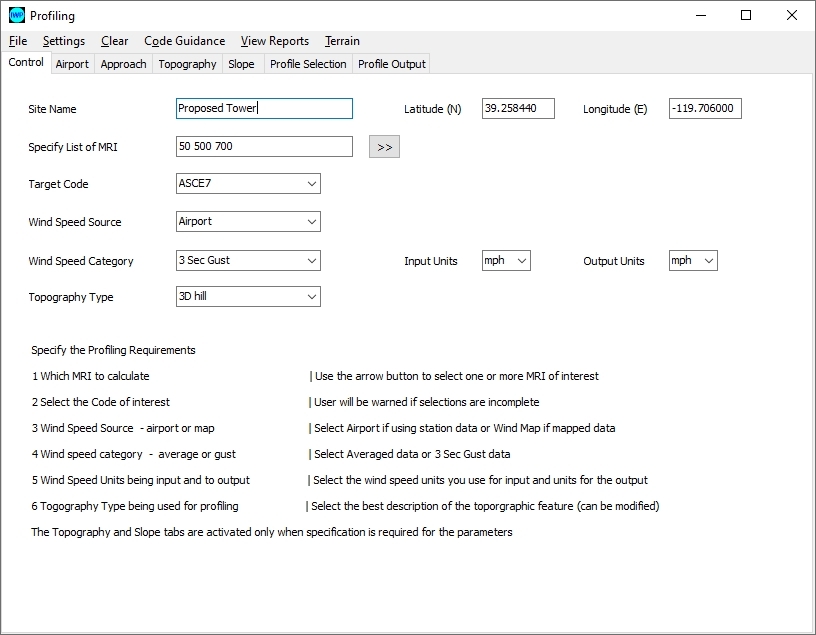
On the Control panel the user specifies:
site identification and location
list of up to 8 MRI (recurrence interval in years) from commonly required values
the target Building Code
the source of the wind data - map wind or airport data which requires specification of airport conditions of terrain
the wind speed category (gust or avg wind)
units to be used in specifying the speed input and required output
the general topography type for the site (Hill, Ridge, Escarpment, flat, etc)
The Topography and Slope tabs will not be displayed if the user selects "flat" for the topography option.
The data specifications for all panels can be saved (Save Project from the File menu) and retrieved from a previously saved run.
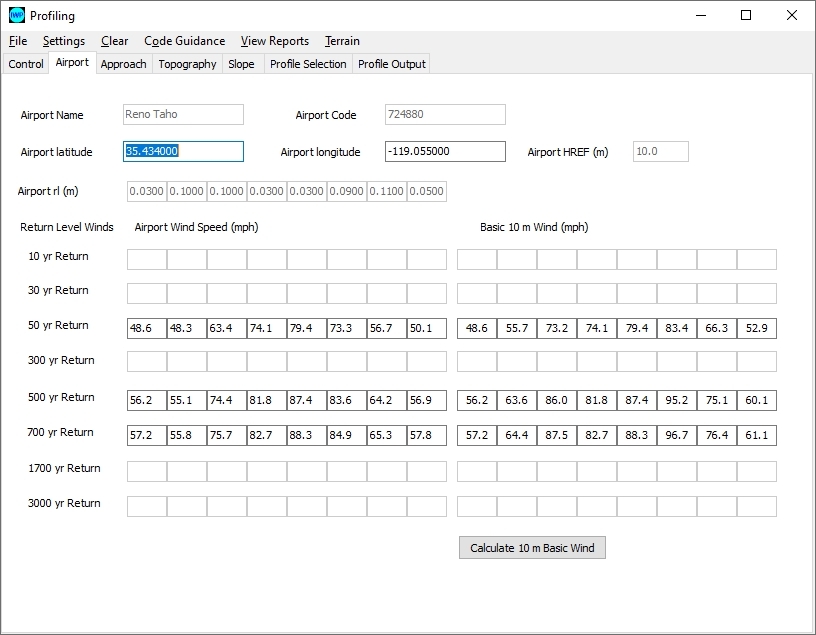
The Airport tab shown below is used both for the case of mapped wind and for specifying airport wind.
In the case of airport wind the user specifies the observed wind speed for each of the return values requested for each directional sector (from 1 to 8 sectors) as well as the representative roughness length at the observing station for each sector over the 1 km fetch to the observing site.
For the case of mapped wind the user specifies the Basic Wind for each sector for each MRI.
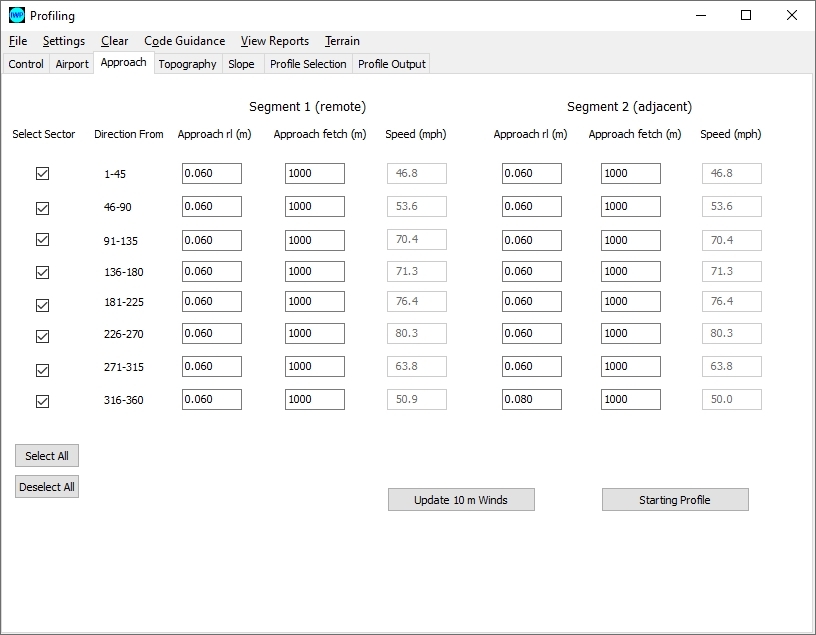
On the Approach tab the user specifies the terrain roughness lengths for each sector on the fetch to the base of the topographic feature. Where there is a change in roughness along the fetch, the user specifies the roughness in two separate segments.
For each 45 degree sector an average roughness length is determined either in Google Earth or from land use/ land cover data using the terrain utility provided.
If there is a abrupt change in the roughness for a sector the fetch is divided into two sectors and data provided separately for the adjacent portion and the remote section.
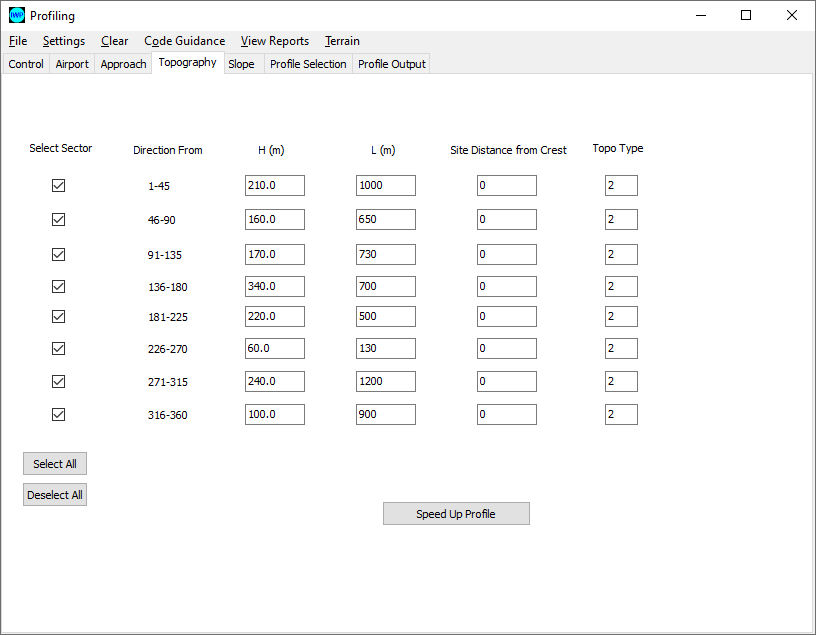
On the topography tab the user specifies the feature type and the steepest slope for each sector.
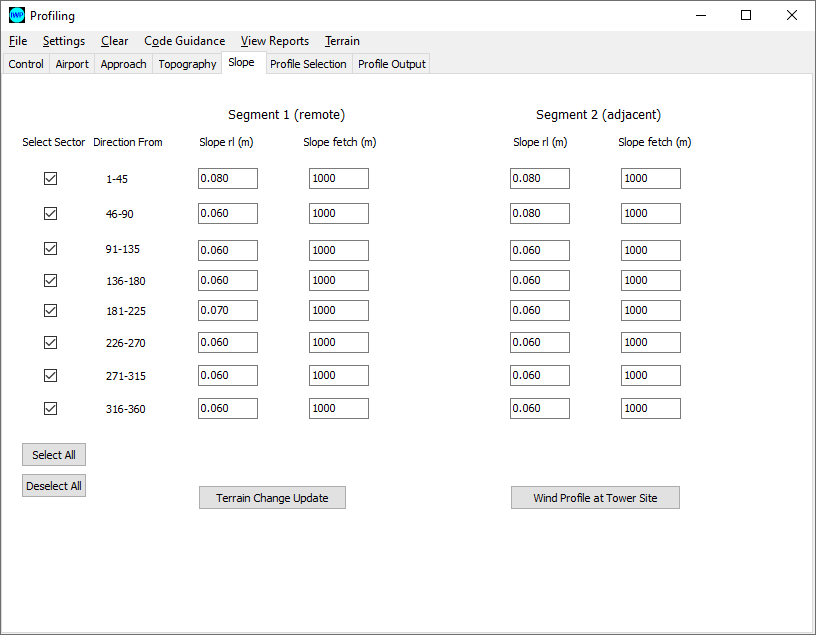
On the slope tab the user determines the roughness on the slope of the feature for each sector. Up to two segments of roughness can be defined for each sector.
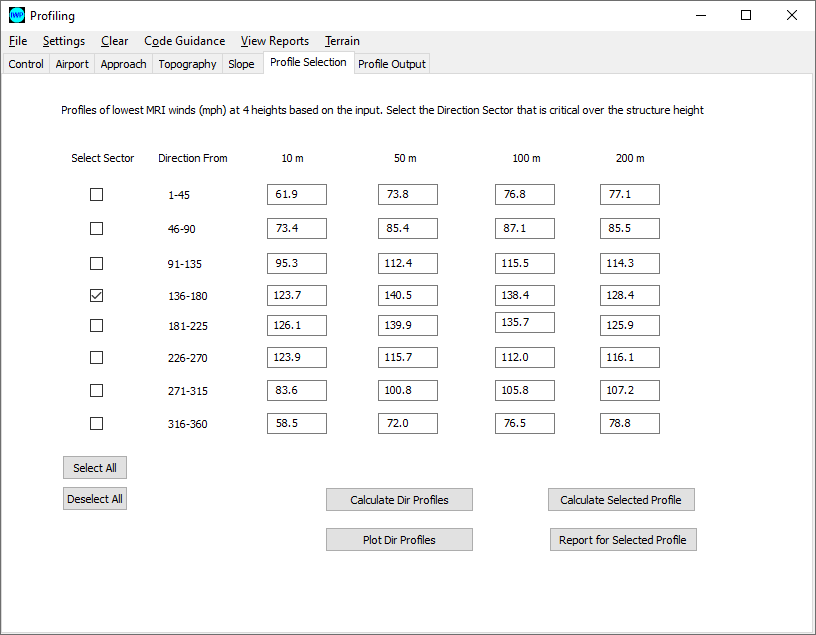
When all of the data has been entered, the Profile Selection Tab provides to the user the option to calculate the profiles, which fills in the wind speed at four heights for each sector allowing the user to determine the sector which produces the worst case wind depending on the height of the tower or structure.
For the selected sector the app then calculates the full details of the profile and produces a full report which includes all of the inputs, the profiles for the sector at the approach to the feature and at the site of the structure, the full profiles for all sectors for each MRI, as well as additional data for turbulence and gust factor profiles derived from the profiles.