Codes such as ASCE7 and TIA 222 in the US and CSA S37 in Canada provide maps of the basic extreme wind and provide procedures for calculating the vertical wind profile based on terrain type and topographic influences. The procedures are based on Guidelines for speed up of wind as derived from meteorological considerations.
The Profcode application provides an interface for the user to enter the required parameters of Basic Wind Speed, Exposure Category, and Topographic specification (Type of feature, Height, Length) and performs the profile calculation according to the specified Building Code. The output is provided graphically as well as in spreadsheet file format to permit direct use of the results in design software or reporting.
As explained in detail for the Profile application, the codes generally require the specification of a single exposure category for the purpose of calculating the speed up. This can be for the entire surroundings of the tower site or for a particular wind direction sector of a minimum of 45 degree sector angle.This sets out minimum fetch distances surrounding the structure site for each of the exposure categories in order to qualify to use the category.
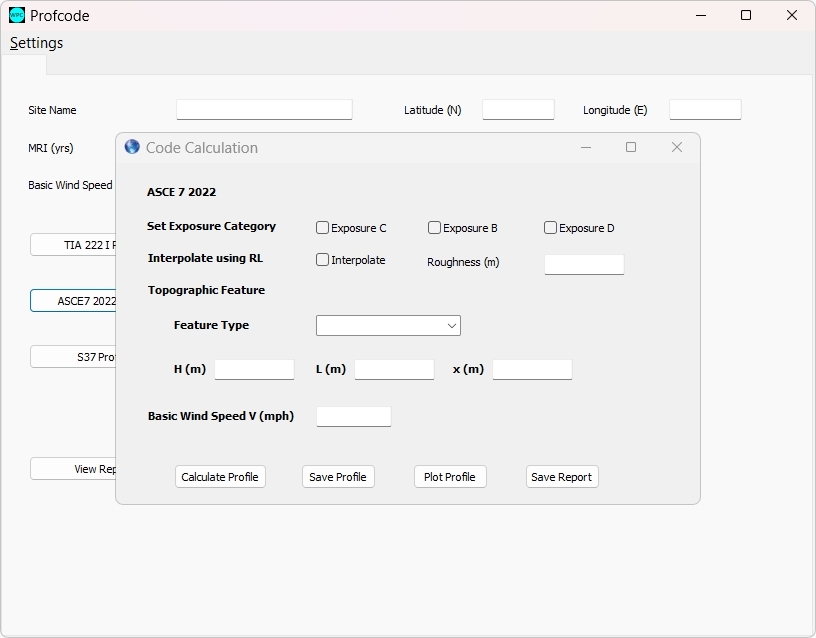
Version 1.1 of the app replaces the 3 categories of exposure by adopting the roughness length at the site as a continuous measure of exposure. The user specifies the roughness length either for a given sector or averaged over the eight sectors as obtained from land cover and land use maps as further explained below. The app interpolates the power law exponent and reduction factor and uses these to calculate the profile. The interpolation function matches the C exposure parameters at roughness of 0.03 m and the B exposure parameters at 0.3 m.
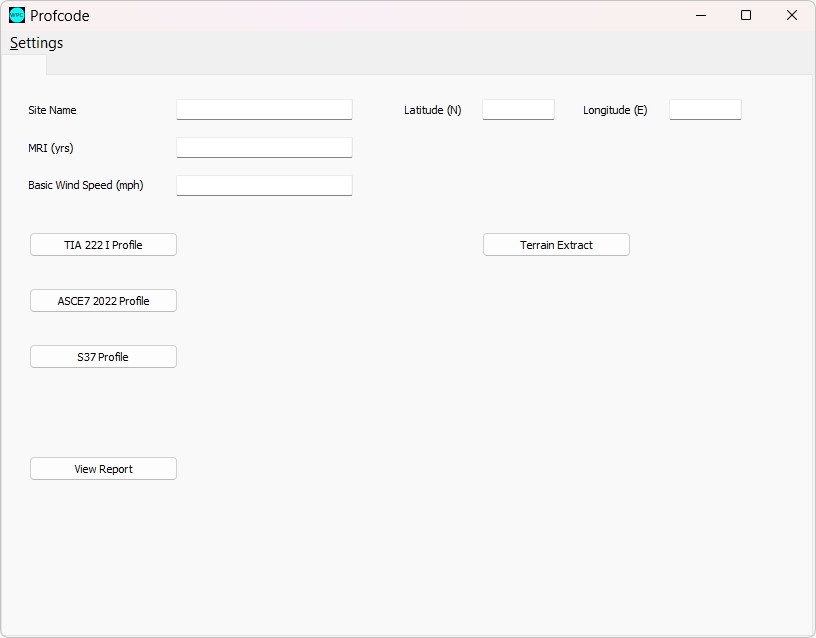
The main page of the app provides the user the choice of building code to use, as well as data entry for the MRI required and the basic wind speed for the site obtained generally from a map supplied by the regulator.
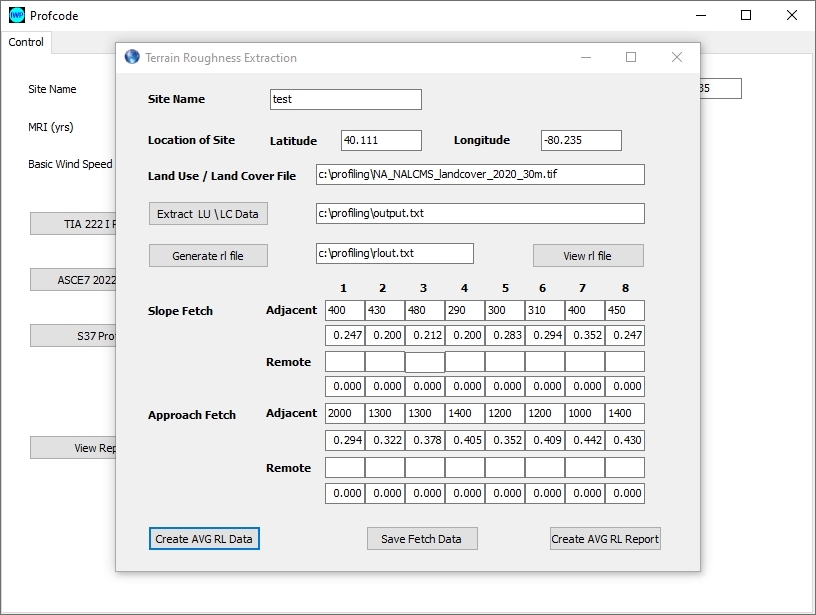
There is also the option to launch the terrain extraction app as shown below which is used to extract land use/land cover data from the 30m resolution mapping for North America and generate roughness length data for each of the 8 sectors surrounding the specified site at 200 m distance interval. This can then calculate the averaged roughness for specified fetch length in order to determine the dominant exposure class for the sector.
Selecting the ASCE7 option from the main page brings up the data entry screen where the user specifies the exposure category, the feature type and parameters as required and can calculate the profile. This can then be viewed as a plot or saved to excel file for further use in design software.
Selecting the S37-18 procedure brings up the screen shown below.
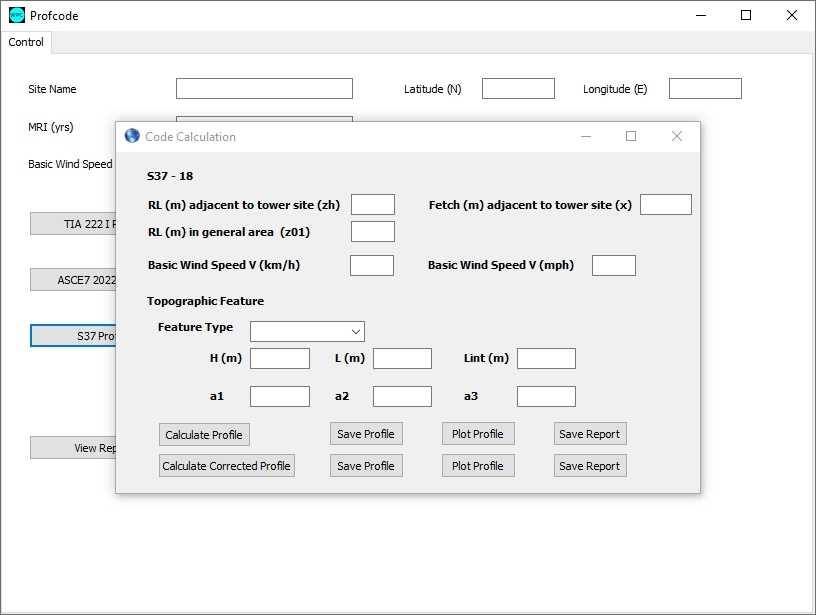
Unlike the ASCE7 and the TIA222, the S37-18 calculation requires the actual roughness lengths to be provided rather than the exposure category, The z01 roughness corresponds to the average for the sector on approach to the topographic feature, while the zh roughness is for the slope roughness and fetch length of the slope for the sector.
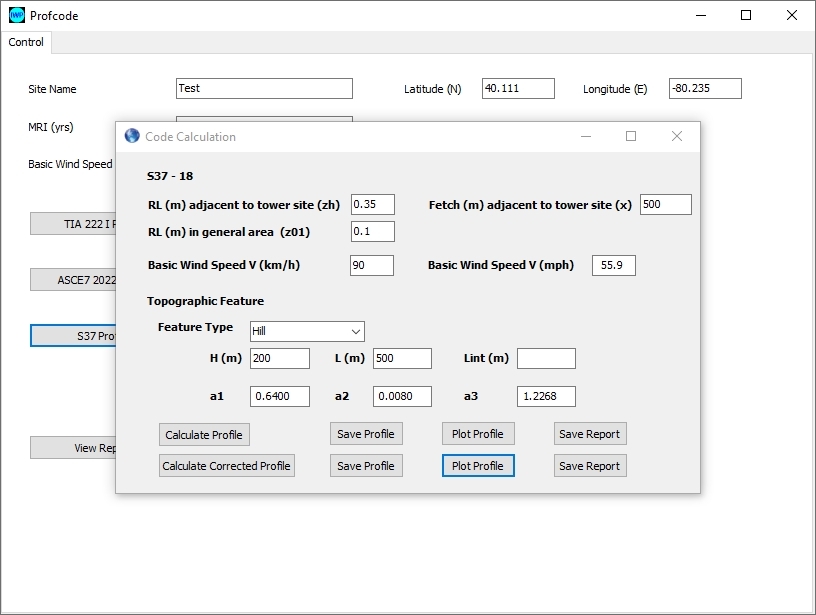
The Basic Wind speed is specified in either km/h or mph, and the topography type and H, L, as well as Lint (distance from crest) are specified.
When the profile is calculated, the parameters a1, a2 and a3 are calculated and displayed on screen. These correspond to the parameters used in the Environment Canada Site Specific equation to calculate the Qh profile at the tower site.
This calculation procedure can also be used in reverse. If you supply the a1, a2, and a3 parameters and leave the H, L blank, then the calculation will fill in the H and L on the screen. This can be used to determine the assumption made in an Environment Canada site specific report to verify the situation that was calculated in the report.
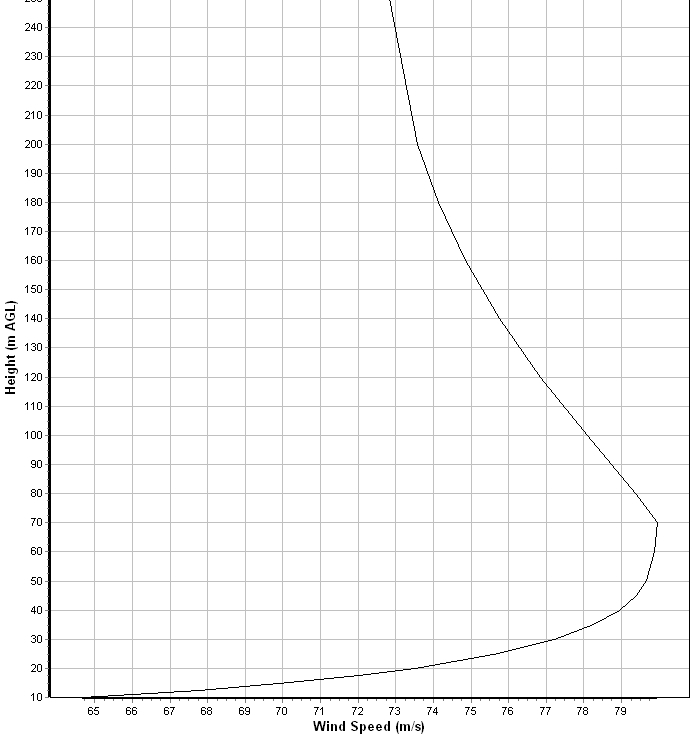
When the roughness lengths zh and z01 are different, as in this case, the profile will show a sharp break as shown in the example below. This arises because the EC calculation equation substitutes a power law profile for the logarithmic profile.
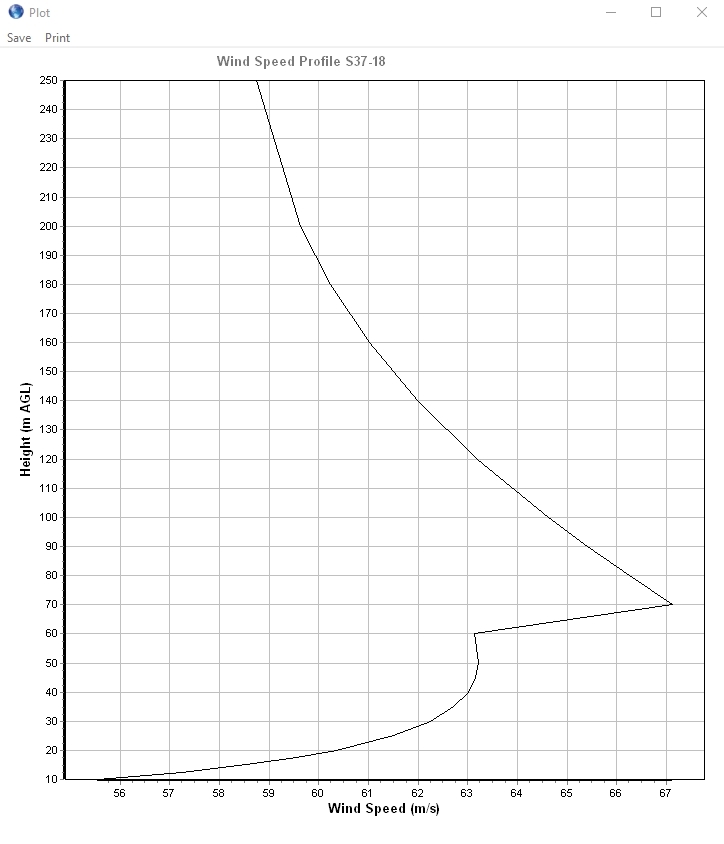
There is a corrected calculation available in Profcode which retains the logarithmic profile and avoids the mismatch in the profile as shown in the next figure.
Note also that the wind speed profile shows no mismatch at the top of the modified layer on the slope and also shows stronger speed up than the power law profile does.