The preparation of an Emission Inventory for an industrial facility is a requirement for Environmental Compliance and generally takes a large effort involving environmental personnel, operating personnel, process engineering support, and dispersion modeling knowledge.
Sophware has developed the fastEIS Windows interface which provides the facilities for creating a comprehensive description of a facility of any size by describing every process in terms of its sources of emissions, their full composition, and the emission points receiving the emission streams.
The data describing the process, source and emission streams is stored in a database and provides a historical record of any changes over time. The user creates the emission rate calculation procedures which can range from simple emission factors to complex computations written in MS Basic.
The interface permits the user to select the current or any historical period and view or report the calculated emissions for the period. The database relations set up for the process permit a multi to multi view, so the user can view or report all emissions by source for a selected process, or conversely view or report all sources and processes which contribute to a specified emission point.
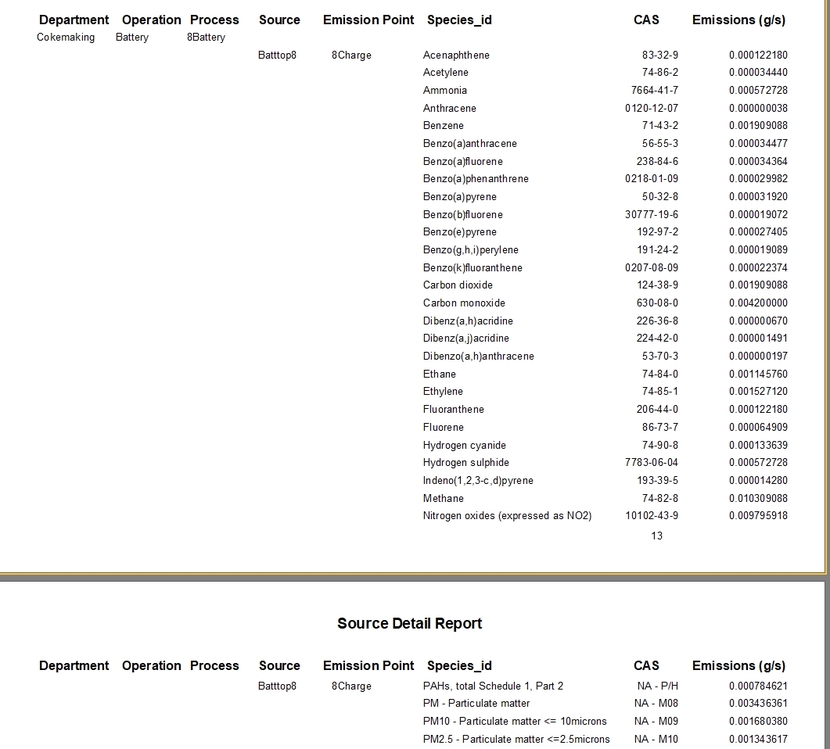
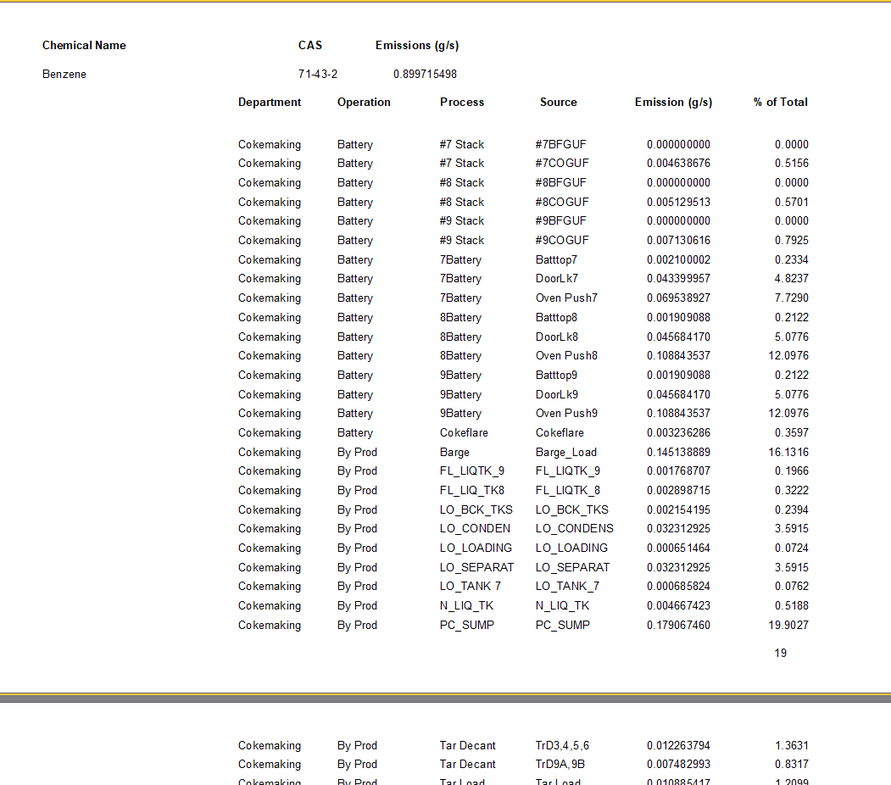
Extensive reporting facilities including source emission summary which lists all chemical emissions from each source or a list of all sources which emit a selected chemical. The latter also permits the generation of detailed emissions by emission point as required for modeling input.
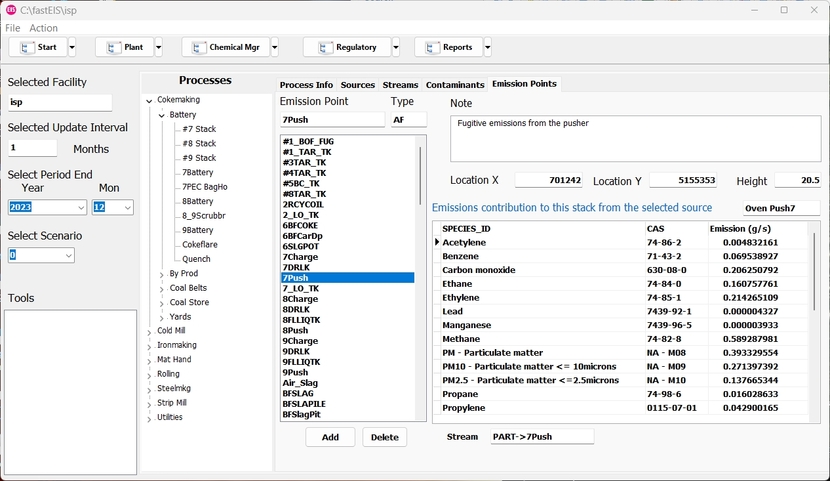
The main screen of fastEIS as shown below provides access to the structure of the plant database, allowing the user to create a new process, source or stream and view current information for all processes for the selected facility. In fastEIS each facility which the user creates is maintained in a separate database which the user configures by assigning a name and selecting the update interval which can be monthly, quarterly or annually.
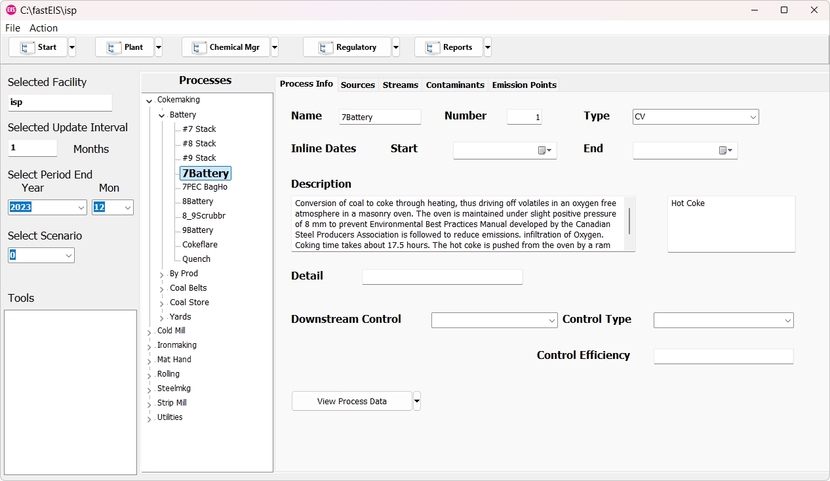
The database stores entered and calculated data for each reporting period. By selecting the period the user is presented with a snapshot of the data for the period, and any changes affect only the data for the selected period. The data is organized by process as seen in the facility tree on the left panel, further grouped by operation and department.
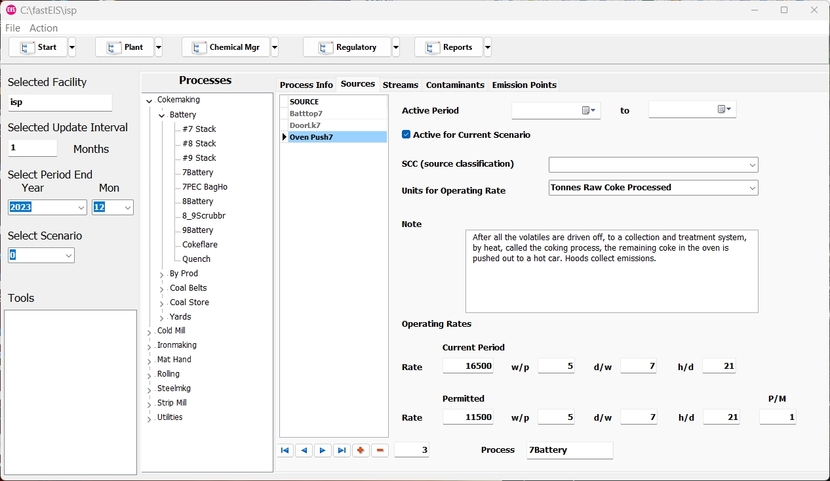
For a selected process, the Sources panel contains the information on all sources of emission from the selected process and the period operating rates and schedule of operation.
For the selected source the Streams panel presents a list of the streams for the source specified by the emitted component and its composition id and the emission point where it is released to the air, liquid effluent or solid waste.
The Procedure panel allows the user to specify a calculating procedure for the emission factor. This is a Windows Basic program which can use variables defined in the procedure or provided from an internal variables database specific to the facility. The procedures created can be stored in a library of procedures for re-use on other streams or processes.
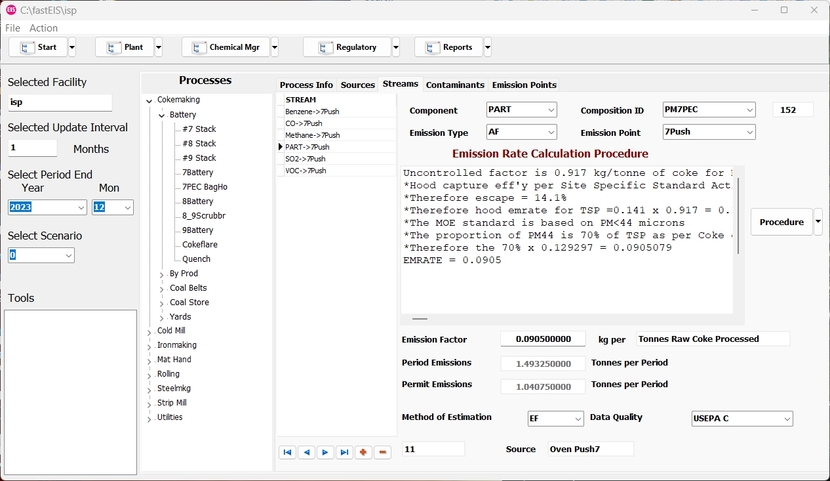
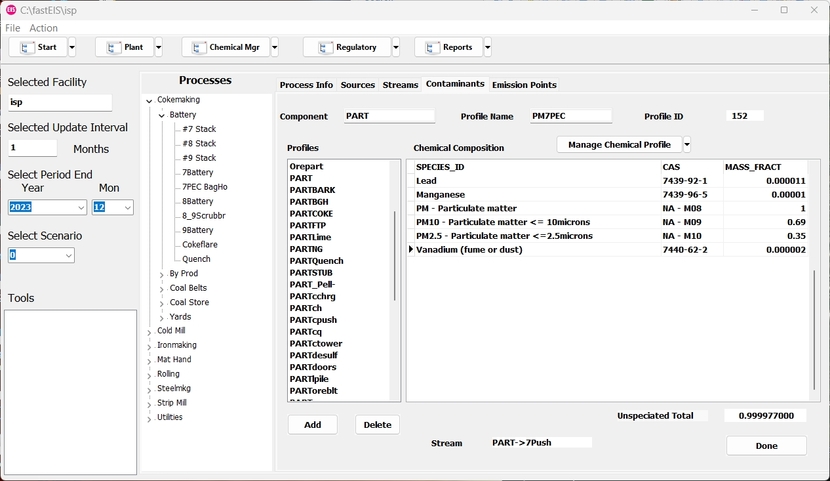
The contaminants tab shows the list of defined components and the composition id for the currently selected stream component.
The Emission Points tab shows a list of the emission points for the facility and displays the emission rate of all chemicals from this emission point as calculated by the stream procedure.
fastEIS provides active reports of various types , including source summary of emissions and chemical emissions summary as shown in the following.
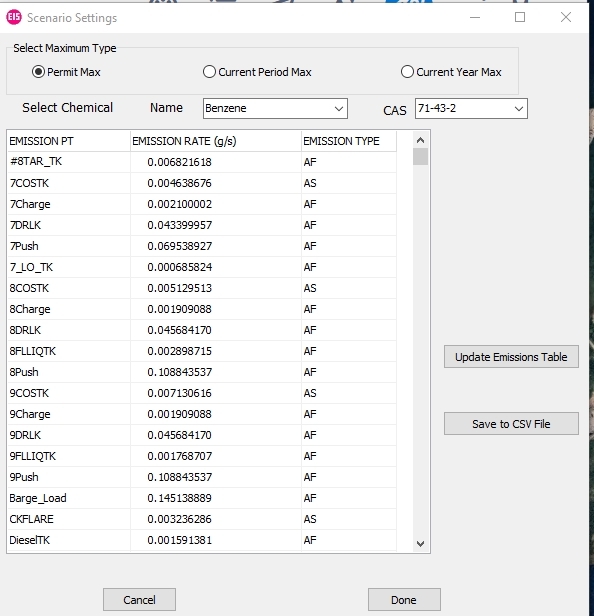
fastEIS also produces emission summaries for insertion into model input files such as in rapidAER, and regulatory reports on model emissions for use in reporting functions.
All of the data is generated and maintained in a SQLite database available to the user for listing, searching and specialized reporting. The database is maintained historically so that the user can see each period of operation in full since inception of the database. If any changes are needed to process, source, or stream definitions and procedures, these are marked with start and end dates so that prior reporting periods are reproduced correctly irrespective of the current state of the facility description.